EMPIRICUS CASH YIELD FI FINANC...
R$ 542,62 mi
Patrimônio Líquido3,33 mil
CotistasV8 SPEEDWAY LONG SHORT FIC FIF...
R$ 295,02 mi
Patrimônio Líquido7,55 mil
CotistasHERITAGE RUBY FIC FI FINANCEIR...
R$ 125,65 mi
Patrimônio Líquido63
CotistasPANAMBY RF HIGH GRADE D31 FI F...
R$ 61,43 mi
Patrimônio Líquido603
CotistasFundo (casca):
BR SHARES IBOVESPA ATIVO FIA
CNPJ da casca:
24.900.135/0001-71
Patrimônio Líquido
Cotistas
Adaptação RCVM 175
PL Médio 12M
BR SHARES IBOVESPA ATIVO FIA
BR SHARES IBOVESPA ATIVO FIA
Alguns fundos de investimento que migraram para a regulação CVM 175 podem apresentar inconsistências nos dados exibidos. Isso se deve a ajustes ainda em andamento no sistema para adaptação ao novo formato. Estamos trabalhando para restabelecer a acurácia das informações o mais rápido possível.
Rentabilidade 12M
Índice de Sharpe 12M
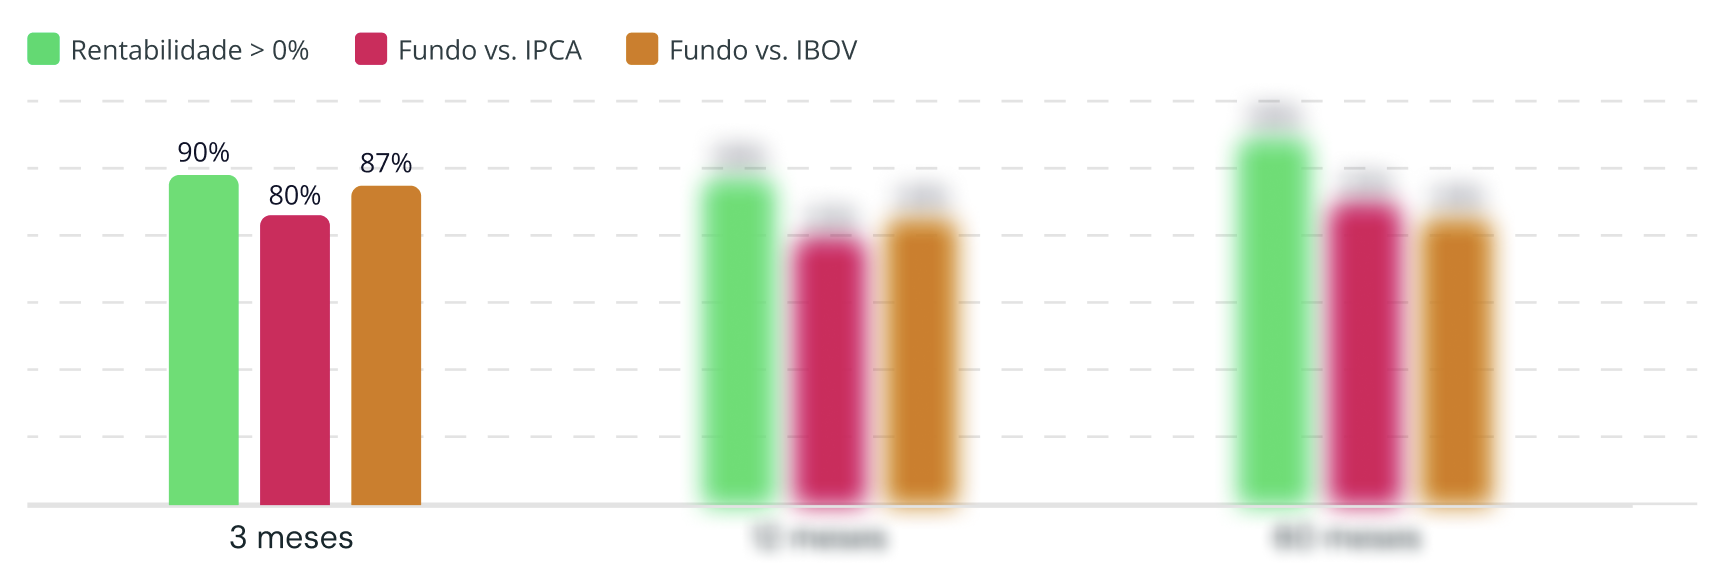
% das vezes em que este fundo tem uma rentabilidade maior que um indicador em uma janela móvel
% das vezes em que este fundo tem uma rentabilidade maior que um indicador em uma janela móvel
Descubra o histórico de sucesso do fundo
Assine o Retorno Prime e tenha acesso a todas as métricas de janelas móveis.
Descubra quantas vezes o fundo apresentou rentabilidade positiva ou positiva ou bateu um índice, considerando diferentes janelas de investimento.
REAG ASSET MANAGEMENT
R$ 26,22 mi
Sob gestão
79
6 operacionais
41,00
Total de cotistas
Fundo (casca):
BR SHARES IBOVESPA ATIVO FIA
CNPJ da casca:
24.900.135/0001-71
Patrimônio Líquido
Cotistas
Adaptação RCVM 175
PL Médio 12M
Rentabilidade 12M
Índice de Sharpe 12M
BR SHARES IBOVESPA ATIVO FIA
BR SHARES IBOVESPA ATIVO FIA
BR SHARES IBOVESPA ATIVO FIA
BR SHARES IBOVESPA ATIVO FIA
ANO | Jan | Fev | Mar | Abr | Mai | Jun | Jul | Ago | Set | Out | Nov | Dez | No ano | Acumulado | |
|---|---|---|---|---|---|---|---|---|---|---|---|---|---|---|---|
| 2018 | BR SHARES IBOVESPA ATIVO FIACDI | 11,41% - | 2,27% - | -2,69% - | -0,86% - | -0,25% - | -- | -- | -- | -- | -- | -- | -- | 9,64% - | 47,62% - |
| 2017 | BR SHARES IBOVESPA ATIVO FIACDI | 7,54% - | 5,18% - | -2,36% - | 1,64% - | -4,92% - | -1,34% - | 5,70% - | 4,64% - | 9,26% - | -0,18% - | -3,09% - | 6,34% - | 30,90% - | 34,64% - |
| 2016 | BR SHARES IBOVESPA ATIVO FIACDI | -- | -- | -- | -- | -- | -- | -- | -- | 0,07% - | 11,37% - | -4,75% - | -3,11% - | 2,86% - | 2,86% - |
BR SHARES IBOVESPA ATIVO FIA
No Mês | No Ano | 3 Meses | 6 Meses | 12 Meses | 24 Meses | 36 Meses | 48 Meses | 60 Meses | Total | |
|---|---|---|---|---|---|---|---|---|---|---|
| Rentabilidade | -0,25% | - | -1,26% | 22,16% | 21,39% | 0,00% | 0,00% | 0,00% | 0,00% | 47,62% |
| Volatilidade | 1,39% | - | 15,87% | 19,49% | 21,96% | 0,00% | 0,00% | 0,00% | 0,00% | 21,02% |
| Índice de Sharpe | -9,44 | - | -0,75 | 2,30 | 0,63 | 0,00 | 0,00 | 0,00 | 0,00 | 0,81 |
BR SHARES IBOVESPA ATIVO FIA
Fundo | Meses Positivos | Meses Negativos | Maior Retorno | Menor Retorno |
|---|---|---|---|---|
| BR SHARES IBOVESPA ATIVO FIA | 1152,38% | 1047,62% | 11,41% | -4,92% |
BR SHARES IBOVESPA ATIVO FIA